Statistics Overview
The Statistics screen gives you insights into your spending patterns.
Accessing Statistics
Tap Your Stats on the home screen or navigate to the Statistics tab.
What You'll See
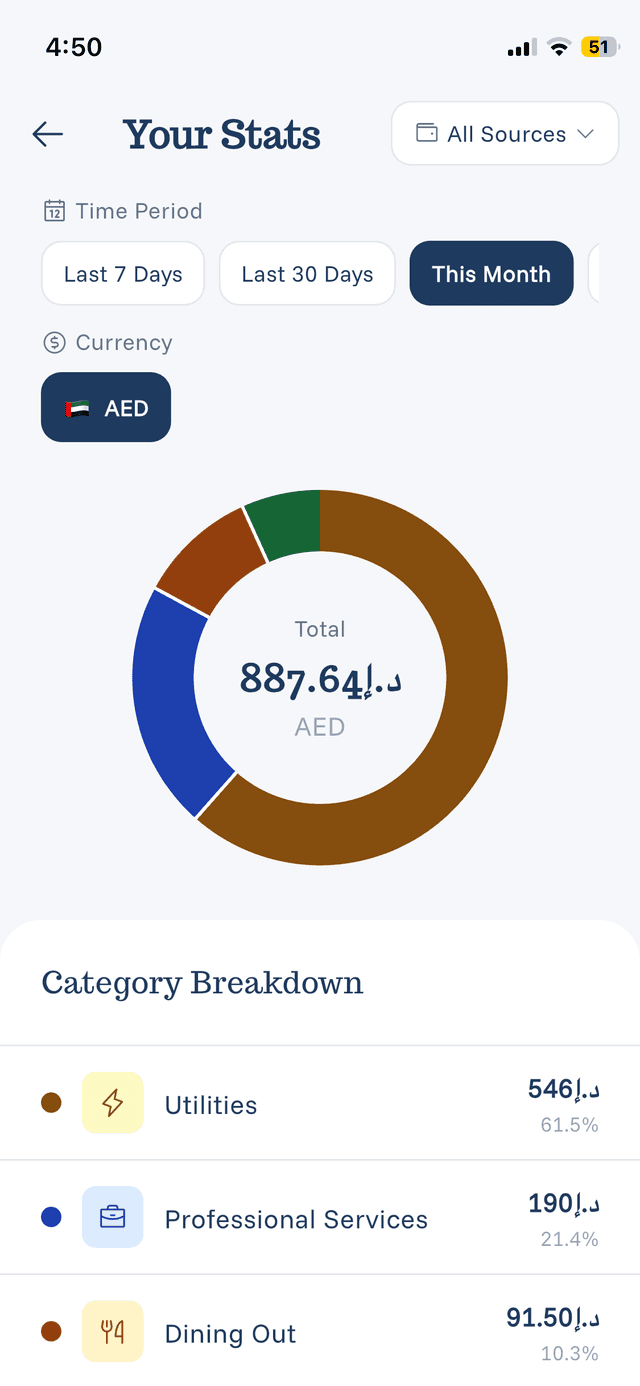
Spending Summary:
- Total spending for the period
- Comparison to previous period
- Breakdown by category
Visual Charts:
- Pie chart showing category distribution
- Bar charts for daily/weekly/monthly trends
- Color-coded categories for easy reading
Top Categories:
- Your biggest spending categories
- Percentage of total spending
- Trend indicators
Time Periods
View statistics for:
- Today
- This Week
- This Month
- Last Month
- Custom Date Range
Understanding the Data
The statistics update in real-time as you add expenses. They help you:
- Identify spending patterns
- See where your money goes
- Track progress toward goals
- Make informed financial decisions